This is the critical Step in the process.
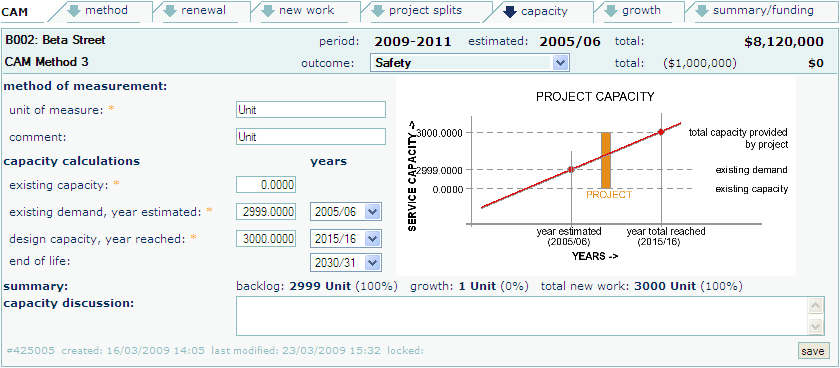
Based on the defined Level of Service the measures that describe the existing capacity, existing demand and total capacity provided by the project are reported. Note that the capacity measures will vary from project to project while still delivering the Level of Service. For example some projects may be designed to support the average daily flows, others the peak flows.
|
The capacity and demand calculations are to be based on the year of analysis which is the year of the current LTCCP. |
Select the required Outcome from the drop down list at the top of the screen.

Projects with multiple Outcomes will require data entry for each individual Outcome.
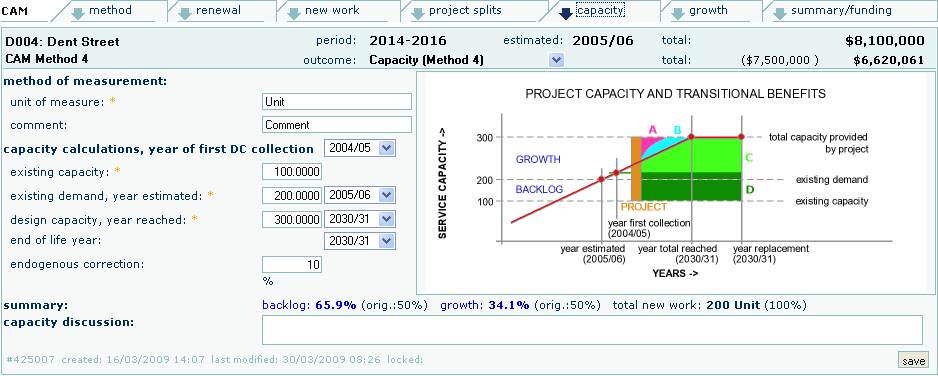
According to the analysis method chosen for each outcome in the Project Splits Screen the capacity screen may display 2 variations of screens.


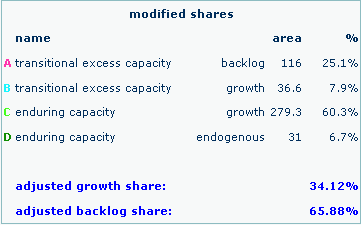
hover over graph to display transitional benefits

Field |
Description |
||
Method of measurement:
|
|||
|
unit of measure |
The unit of measure in which the Capacities were measured. |
|
|
|
Mandatory field. |
|
|
comment |
Commentary to clarify the unit of measure used. |
|
Capacity calculations:
|
|||
|
year of first DC collection |
The year of first planned DC collection |
|
|
existing capacity |
The existing Capacity of the current infrastructure. |
|
|
existing demand |
The existing demand of the existing community. |
|
|
|
year estimated |
The year in which the existing demand was estimated. |
|
Displayed as the estimated year at the top of the screen. |
||
|
design capacity |
The total Capacity of the existing infrastructure plus the capacity to be added by the planned Project. |
|
|
|
year reached |
The year in which the total Design Capacity will be reached, based on current projections. |
|
end of life |
The year in which the planned works will be replaced. |
|
|
endogenous correction |
Where it is assessed that the endogenous correction should be applied; that correction will be the percentage of total annual growth that equates to changes in the existing community use. |
|
|
|
This adjustment to the outcomes recognises that not all growth results from the incoming community. Some growth arises from the existing community. |
|
|
|
e.g. increased vehicle usage per person, or the increased household water usage through addition of appliances |
|
|
capacity discussions |
Commentary that confirms the Capacity recordings. |
|
Backlog (non-growth) portion of new work |
existing demand - existing capacity |
Growth portion of new work |
design capacity - existing demand |